 dagron
Get started
From an empty directory to a workflow you can watch run, then a tour of every screen in the console — what each region is, and which API call is behind it. If dagron is going to be the thing your team runs work on, this is the page to read first.
On this page
Bring up a stack
Everything on this page uses the Docker Compose quickstart, because it is the one that brings up the console — the web UI the rest of this page explains. One command, no configuration:
$ git clone https://github.com/lucheeseng827/dagron
$ cd dagron
$ docker compose -f compose.quickstart.yaml up -d
# podman compose works identically

# console at /, API at /api — one origin, one port
http://localhost:8080
That starts four things: postgres (the datastore, and the only state that exists),
the engine (the reconcile loop and the executors — it also applies the migrations),
dagron-api on :8080 (the authenticated gateway, which also
serves the console), and a seed step that creates the admin user. Serving the pages from the
same origin as /api is what makes the live updates work.
Two other ways in, if you do not
want containers: a single binary — dagron dev workflow.yaml gives you the
engine and a Swagger UI on 127.0.0.1:8787 against a SQLite file, with no console —
and Helm for Kubernetes. Both are on the Overview, and
the workflow YAML is identical in all three.
Sign in
Open http://localhost:8080 and sign in with the admin the quickstart
seeded:
email     admin@local
password  dagron-admin
dagron-api owns login and mints its own HS256 session cookie, so there is no
identity provider to stand up for local work. The credentials come from
DAGRON_ADMIN_EMAIL / DAGRON_ADMIN_PASSWORD in the compose file —
change them there before anyone else can reach the port.
First look — the Overview
You land on Overview. It answers one question — is anything wrong? — before it shows you anything else, and everything on it is a live read, not a cached digest.
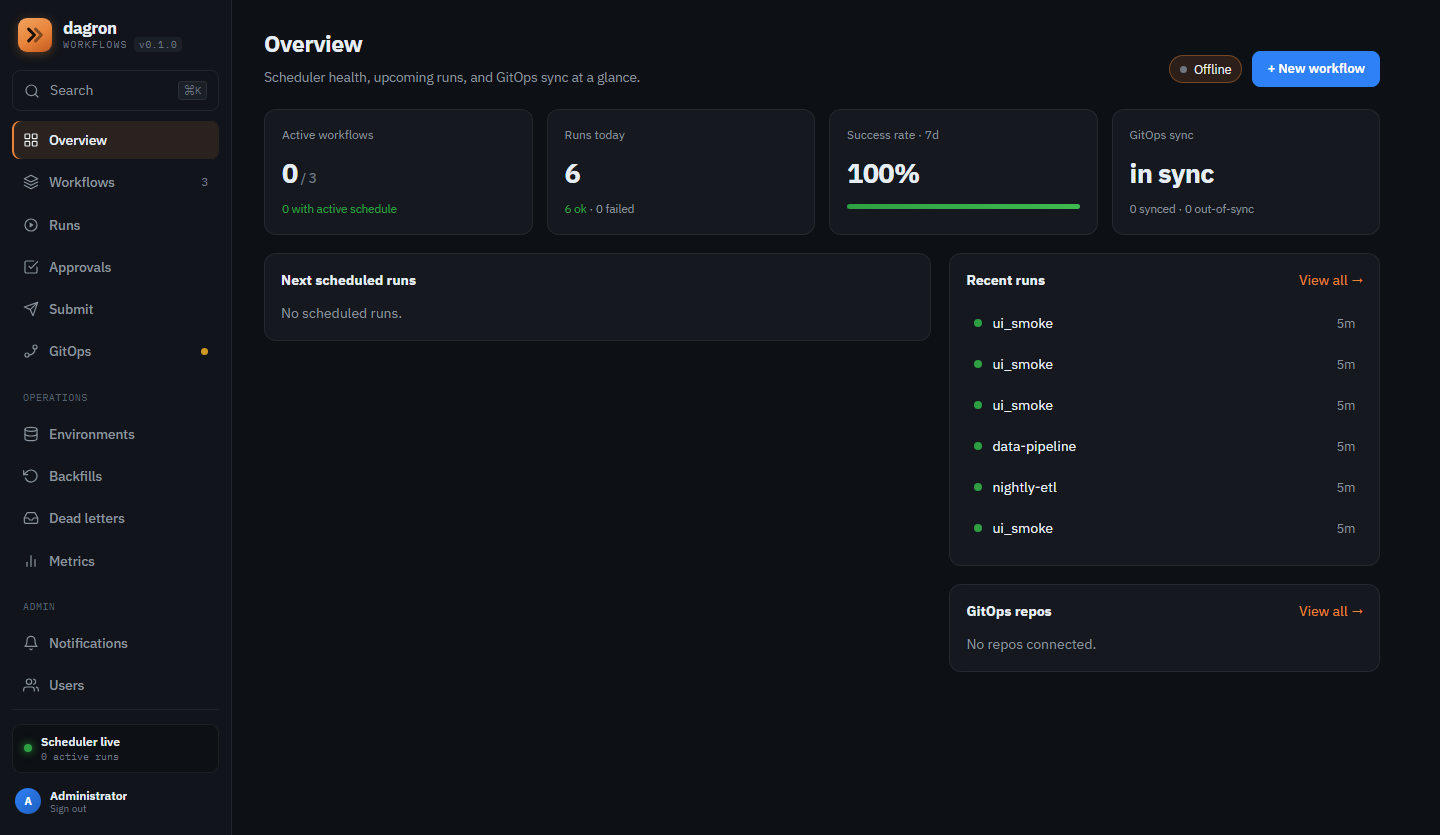
- The navigation rail. Grouped rather than flat: the working set at the top
(Overview, Workflows, Runs, Approvals, Submit, GitOps), then Operations — Datasets,
Environments, Backfills, Dead letters, Metrics — then Account and Admin. The count beside
Workflows is live (
3here), and the amber dot on GitOps marks a section with something to look at. - Search (
⌘K). One palette over workflows, runs and schedules. Run ids match by prefix, names by substring, so pasting the first eight characters of a run id finds it. Backed byGET /api/search. - The Live lamp. Lit means this page is attached to the server-sent event stream
(
GET /api/events/stream) and is updating itself. Turn it off and the page stops re-rendering — useful when you are reading a list that keeps moving. - Needs attention. The banner is the point of the page. It collapses failed runs, pending approvals, dead letters and out-of-sync repositories from the last 24 hours into one sentence. When it says nothing needs attention, as here, you can stop reading the screen.
- The four tiles. Active workflows (
0of3, and how many carry a schedule), runs today split ok/failed, the 7-day success rate, and GitOps sync state. Each is a link into the filtered list behind it. - Next scheduled runs / Recent runs / GitOps repos. The three things you would otherwise go looking for. Recent shows the six newest runs with a status lamp each — green for succeeded — and every row opens that run.
- The scheduler lamp. Pinned to the bottom of the rail because it is the one thing whose failure invalidates everything above it. Scheduler live with the active-run count means a node currently holds the leader lease and is dispatching work.
Author your first workflow
Click + New workflow. The editor opens with two views of one spec, switchable at the top and always in sync:
- Visual — a canvas plus a Blocks rail of premade steps (S3 staging,
CSV → Parquet, dbt run, train model, approval gate, webhook notify…). Click a
block to append and auto-chain it, drag it onto the canvas to place it unchained, or drop
it onto an edge to splice it in —
a → bbecomesa → block → b. Drag a node's bottom handle onto another node to add a dependency. Cycles are refused as you draw them. - YAML — the whole spec, with the same live graph beside it.
Pick Start from an example… to skip the blank page. The workflow shown in the screenshots below is this one — an extract, three transforms that run in parallel, and a load that waits for all three:
name: nightly-etl
tasks:
  - name: extract
    command: ["sh", "-c", "echo 'extract: 1,284 rows from orders_raw'"]
    max_attempts: 3
    retry_delay_secs: 2

  - name: transform-orders
    command: ["sh", "-c", "echo transform orders"]
    depends_on: [extract]

  - name: transform-customers
    command: ["sh", "-c", "echo transform customers"]
    depends_on: [extract]

  - name: transform-inventory
    command: ["sh", "-c", "echo transform inventory"]
    depends_on: [extract]

  # waits for all three — that is the whole fan-in
  - name: load
    command: ["sh", "-c", "echo load"]
    depends_on: [transform-orders, transform-customers, transform-inventory]
    timeout_secs: 300
There is no scheduler DSL and no Python to import: depends_on is the whole graph
language. Click Save and you are taken to the saved workflow, where ▶ Run,
Sync to Git, Delete and the Schedules drawer appear.
The fields a task can carry
| Field | YAML key | Meaning |
|---|---|---|
| Command | command | argv to execute, e.g. ["sh","-c","echo hi"]. |
| Docker image | docker_image | Image to run the command in. Empty = the host executor. |
| Depends on | depends_on | Task names that must finish first — the DAG edges. |
| Max attempts | max_attempts | Attempts on failure. Default 1, meaning no retry. |
| Retry delay | retry_delay_secs | Base backoff; the actual wait is base · 2^(attempt−1), clamped by retry_max_delay_secs. |
| Timeout | timeout_secs | Per-task wall-clock budget. |
| Run when | trigger_rule | When this task fires given its dependencies' outcomes: all_success (default), all_done, one_failed, all_failed, none_failed. This is how you attach a cleanup or a failure handler. |
| Runs workflow | workflow_ref | Run another saved workflow as this step — a DAG of DAGs. |
| Calls template | template + arguments | Call a reusable sub-DAG declared under templates: in the same spec. |
| Approval gate | type: approval | No command: the run parks until a human approves or rejects it. Optional approval_timeout_secs with approval_on_timeout: reject (default) or approve. |
Two more live at the top of the spec beside name:
run_timeout_secs cancels the whole run past a wall-clock budget, and
result_from nominates the task whose output becomes the run's result — which is
what a synchronous caller gets back from /wait.
When the Visual tab is
disabled. The canvas draws one node per task, so a spec using with_items:
(one task fanned out into many), hook:, type: wait sensors or
cache: would be drawn as a picture that lies about what runs. The editor greys
the Visual tab out and names the fields responsible rather than let you edit that drawing.
Nothing is lost — the spec is untouched and fully editable as YAML.
The Workflows list
Saved workflows live under Workflows. This is the inventory view — one row per definition, with enough history in it to see which ones are healthy without opening any.
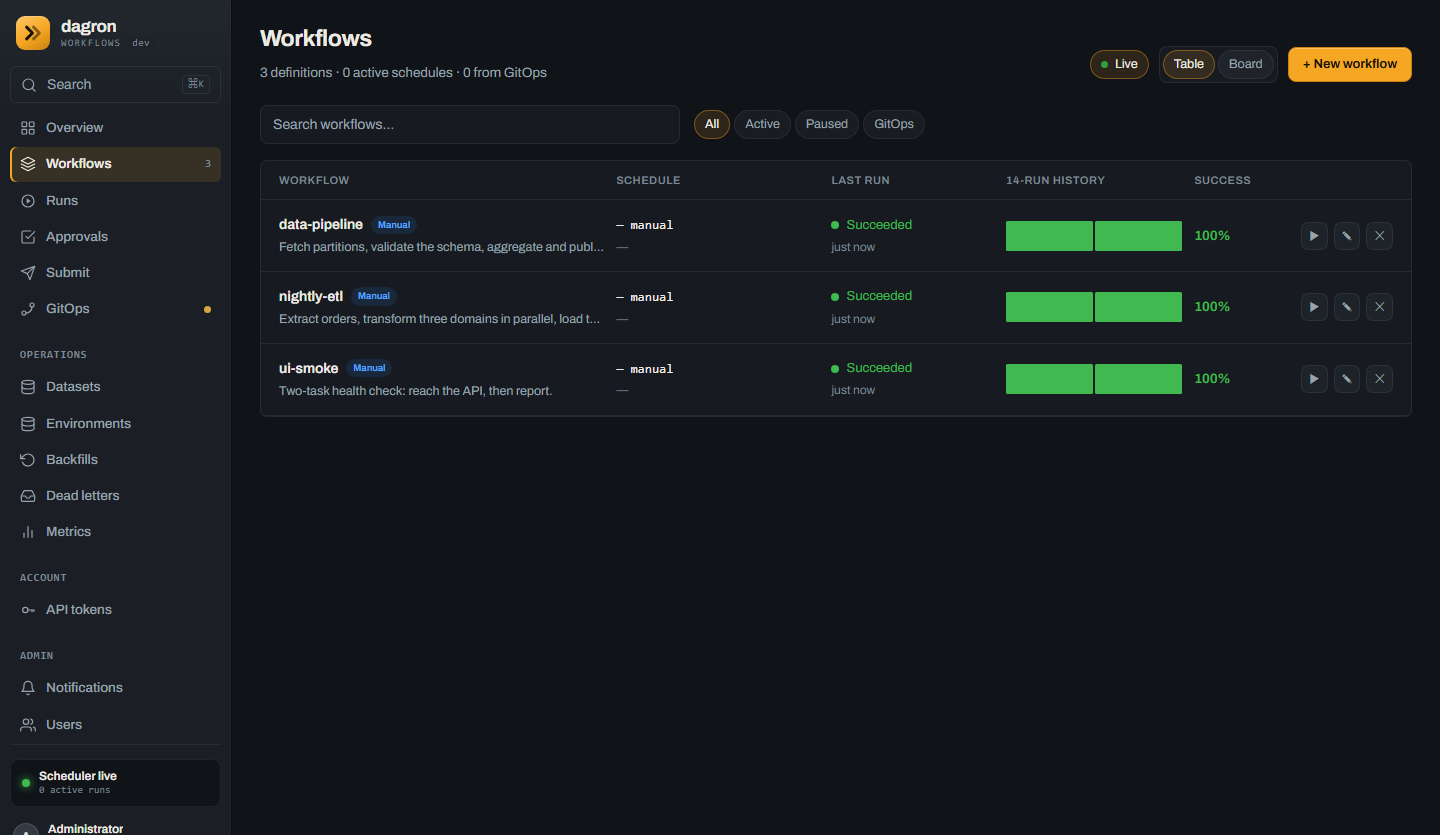
- The subtitle counts what you have — definitions, how many carry an active schedule, and how many arrived from a connected Git repository rather than this editor.
- Table or Board. The same rows as a dense table, or as status cards. Both read
GET /api/workflows, which returns each row already enriched with its schedule and a recent-run digest, so the list is one request rather than one per workflow. - Search and the state filters. All / Active / Paused / GitOps. A workflow's
state is a first-class field:
pausedandretiredboth refuse to start runs, but keep their schedules — which is almost always what someone reaching for Delete actually wanted. - The badge beside each name is how the workflow gets triggered — Manual here,
a cron expression where one is set. The line under it is the spec's
description. - 14-run history. One bar per recent run, newest on the right, coloured by outcome. An intermittently failing workflow is visible here as a striped strip without opening anything.
- Row actions. Run now (▶), edit (✎), delete (✕). Delete is
admin-only and cascades to that workflow's schedules — it is the one irreversible control
in the console, which is why the API answers a non-admin with a message naming
state: retiredinstead.
Run it and watch it
Click ▶ Run. You land on the run view, and this is the screen you will spend real time in. Nothing here polls: task state arrives over SSE as the engine writes it.
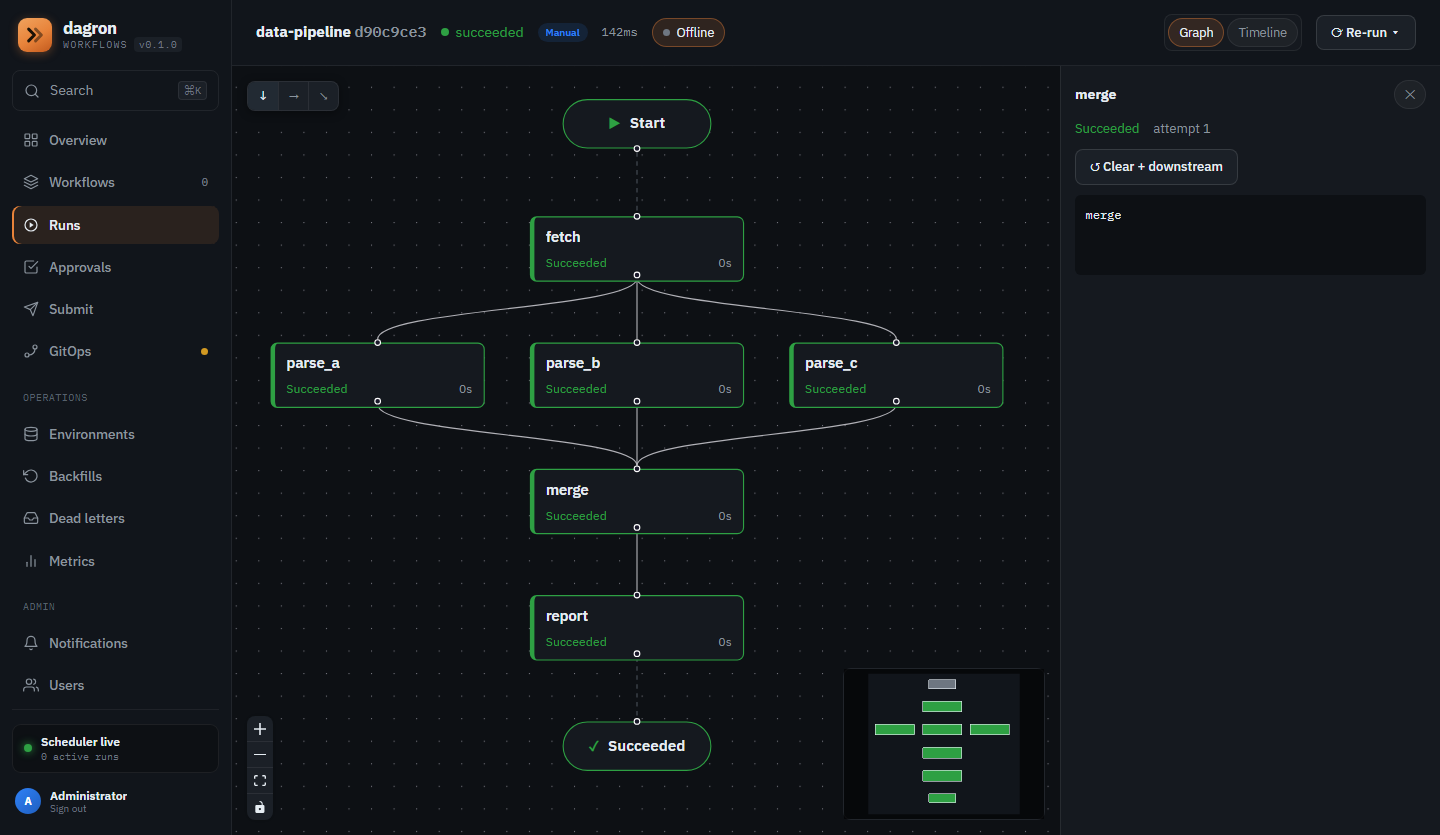
- The run header. Workflow name, the short run id (
814ef5a3— the prefix the search palette matches on), the run's status lamp, what triggered it, and the elapsed wall clock. Live here is this run's own stream,GET /api/runs/{id}/stream. - Graph / Timeline / Logs. Three readings of one run: the dependency structure, the same tasks laid out against time — where you see what actually ran in parallel versus what queued — and every task's output merged into one attributed stream.
- Re-run. A menu, not a button: re-run the whole thing, re-run from a chosen task, or re-run with changes, which opens the stored spec in an editor. A run always keeps its own snapshot of the definition it was made from, so this is exact even if the workflow has been edited since.
- Layout direction. Top-down, left-right, or diagonal. A wide fan-out reads better left-right; a long chain reads better top-down.
- The graph. Start and the terminal node are the run's own boundaries, not
tasks. Every real task is a node carrying its name, status and duration, and the node
border is the status: green for succeeded here. The three
transform-*tasks sit on one rank because they have the same single dependency — that is the parallelism, drawn. - Zoom, fit and lock at the bottom left; the minimap at the bottom right keeps you oriented once a DAG outgrows the viewport, and stays coloured by status so you can see a red node off-screen.
- The task panel. Click any node. Status, which attempt it finished on, and that task's captured output. Clear + downstream resets this completed task and everything that depends on it, then lets the scheduler redo exactly that cone — the surgical recovery you want when one step was wrong and the twenty before it were not.
- The log filter. The input and the level chips (error, warn, info, debug, trace,
plain) filter server-side, not in the browser. A run's captured output can be
hundreds of megabytes; shipping all of it so the page can grep would be a download, not a
filter. The same grammar works from
curland the SDKs — see the API page.
What the statuses mean
| Status | What it means |
|---|---|
pending | In the run, dependencies not yet satisfied. |
ready | Dependencies satisfied; waiting for a worker slot, a runner class, or a concurrency pool. |
running | Claimed by a worker, which renews a heartbeat lease every 10 s — so an eight-hour step is never mistaken for a dead one. |
awaiting_approval | An approval gate is parked on a human. It appears in Approvals as a worklist across every run. |
succeeded / failed | Terminal. A failed task is retried while max_attempts allows; the attempt counter in the task panel is how many it took. |
cancelled | Stopped by an operator, or by the run's own run_timeout_secs. |
When something breaks, the recoveries are all on this screen: retry the one task, clear + downstream to redo a cone, re-run from a task to resume the failed frontier, or cancel the run. You can also triage a failed run — mark it acknowledged, resolved or ignored with a note — so that "we have decided not to care about this one" is recorded as a different answer from "fixed".
Find it again — Runs
Runs is every execution across every workflow, newest first. Overview answers is anything wrong; this answers what happened.
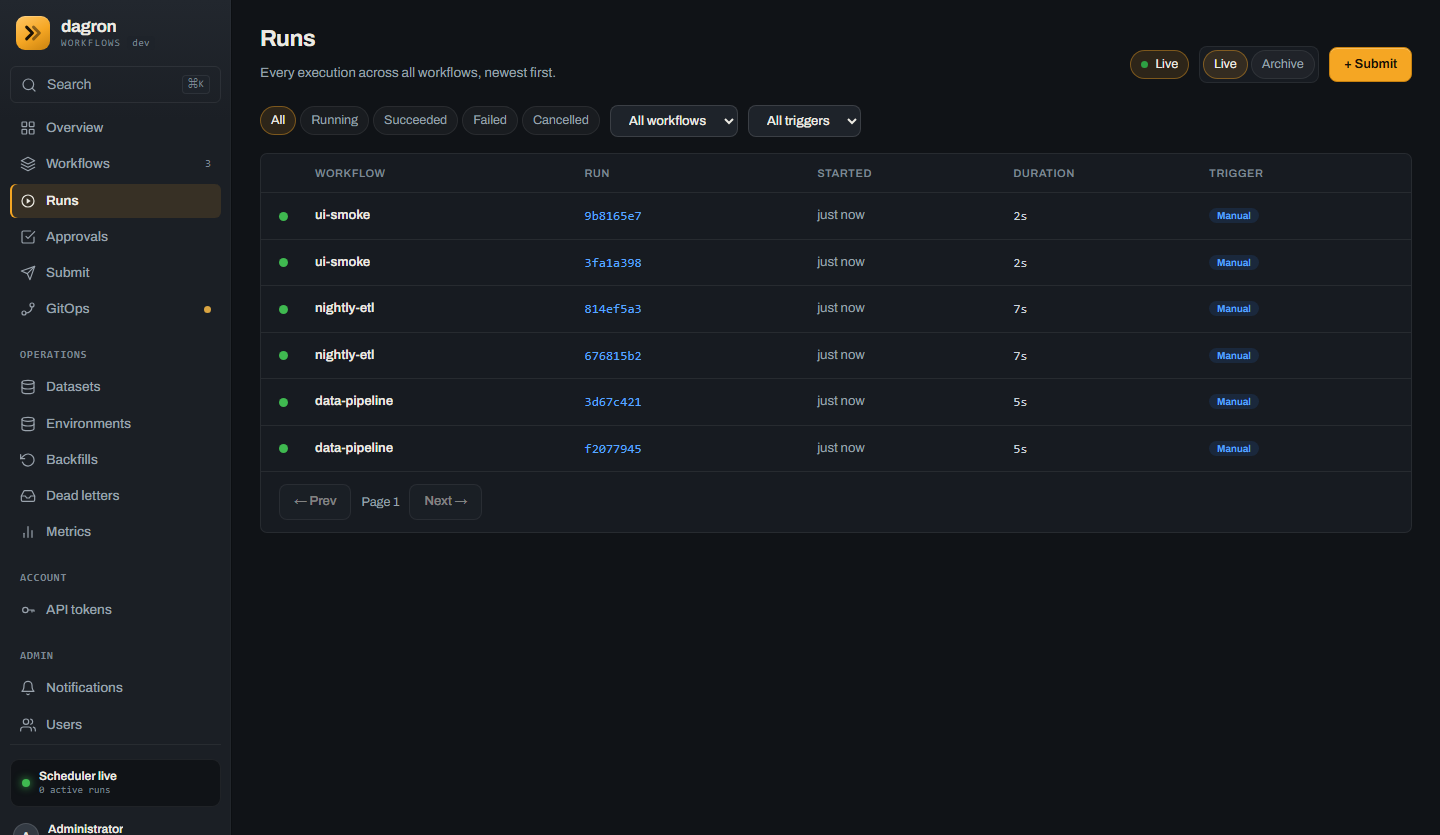
- Live / Archive. Two stores behind one screen. Live is the hot database; Archive reads runs the retention sweep has already exported and purged, so history outlives the hot window without keeping it in Postgres forever.
- + Submit runs ad-hoc YAML without saving a workflow first — the same path as
POST /api/runs, with the Blocks rail available. - Status chips and the two dropdowns map exactly onto the query parameters of
GET /api/runs:?status=,?name=,?trigger=. Whatever you can filter here you can filter from a script. - The run id is the link, and the short prefix shown is enough to paste into
⌘Klater. - Trigger is derived, not stored: Manual, Schedule or Backfill, resolved from the schedule stamp or the backfill ledger. It is how you tell a run someone started by hand from one the clock started.
- Paging is offset-based (
?limit=,?offset=), default 100 per page and capped at 500 — the same bounds the API enforces.
Read the trend — Metrics
The per-run views tell you about one run. Metrics is the shape of the whole deployment over time.
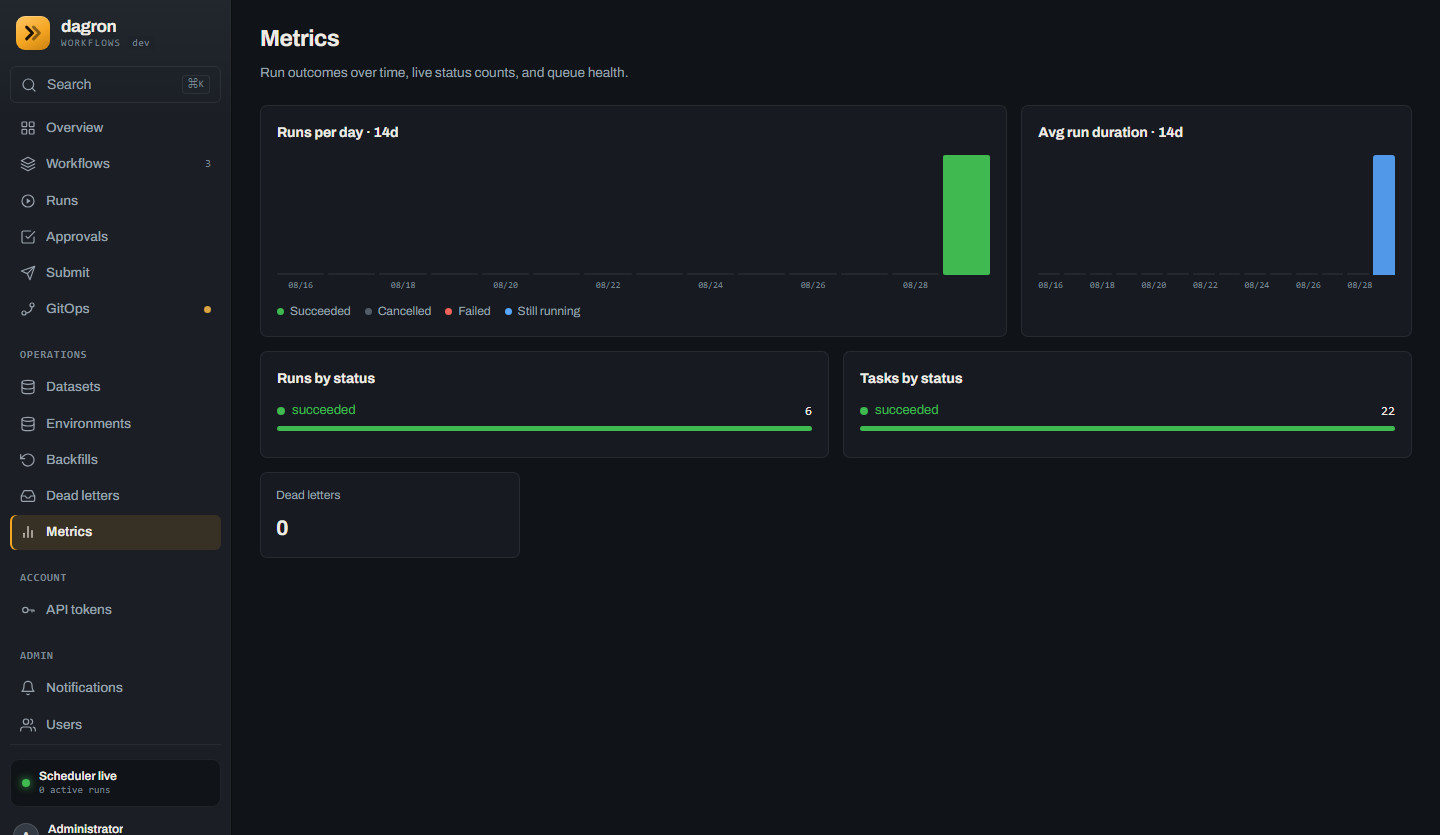
- Runs per day · 14d, stacked by outcome — the legend names all four
(succeeded, cancelled, failed, still running). The window is adjustable from 1 to 90
days via
GET /api/metrics/timeseries?days=, and can be narrowed to a single workflow with&name=to get that workflow's own trend. - Avg run duration · 14d, off the same buckets. This is the chart that catches the regression a success rate hides: everything still passes, it just takes twice as long.
- Runs by status and Tasks by status are live counts, not the 14-day window —
GET /api/metrics. Tasks outnumber runs (22against6here) because each run carries several. - Dead letters is queue health: ingested work that failed its attempts and was parked rather than dropped. Non-zero is a number to act on — the Dead letters page lets you inspect the payload and redrive it into a fresh run once the cause is fixed.
This page is the console's own rollup. For Prometheus, scrape the engine's
/metrics endpoint instead — process counters and live gauges in text format,
documented on the API page.
The same thing without a browser
Every screen above is a client of the same public API, and nothing in the console is privileged. Sign in, submit, block until it finishes:
$ API=http://localhost:8080

# 1. Sign in — or mint a personal access token once and skip this step
$ TOKEN=$(curl -s $API/api/login -H 'content-type: application/json' \
    -d '{"email":"admin@local","password":"dagron-admin"}' | jq -r .token)

# 2. Submit the YAML. Idempotency-Key makes a retry safe to send twice.
$ RUN=$(jq -Rs '{yaml: .}' < nightly-etl.yaml | curl -s $API/api/runs \
    -H "authorization: Bearer $TOKEN" -H 'content-type: application/json' \
    -H "idempotency-key: nightly-$(date +%F)" --data-binary @- | jq -r .run_id)

# 3. Block server-side until it reaches a terminal state
$ curl -s "$API/api/runs/$RUN/wait?timeout_secs=120" \
    -H "authorization: Bearer $TOKEN" | jq
{ "run_id": "…", "status": "succeeded", "finished": true,
  "result": "load", "failure": null }
That is the whole synchronous shape: submit, wait, read the result. If it had failed,
failure would carry the earliest-finished failed task, its attempt count and the
tail of its output — the reason, in the response you are already holding, without a second
call.
For anything beyond this — every endpoint, the auth model, the log filter grammar, SSE, the Python and TypeScript SDKs, and the MCP tools an agent calls — see the HTTP API reference.
Where to go next
HTTP API
Complete coverage of both surfaces — the authenticated gateway your automation and the console use, and the engine's cluster-private ops API — plus the SDKs and the MCP tool catalogue.
ReferenceCLI & configuration
Every binary, positional argument, environment variable and Cargo feature dagron reads. Where you go to point it at your own Postgres, switch the executor to Kubernetes, or turn on the artifact store.
OperateAdmin & maintenance
Before this carries anything you care about: monitoring and health, backup and restore, dead letters, API tokens, secrets, and a symptom-first troubleshooting table.
OperateScaling & HA
What to change when one engine stops being enough — multiple replicas under a leader lease, runner classes, concurrency pools, and the Kubernetes executor.
Three things worth trying next in the console itself: add a Schedule from
the editor's drawer and watch the trigger badge change from Manual to the cron
expression; add an type: approval task and see the run park in Approvals;
and connect a repository under GitOps so the definitions live in Git and arrive by pull
request instead of by edit.